GIS Web Applications and Data Visualization
- Home
- GIS Web Applications and Data Visualization
GIS Web Applications and Data Visualization
Today, geolocalisation is everywhere around us. It exists several desktop softwares, propietary such as ESRI ArcGIS or open source such as QGIS, that allow to import, process and visualize geodataset. However, at the very end of a GIS project, the deliverables are limited to a written report, a processed dataset (.csv, .shp, or .gdb) and a ArcGIS or if lucky, a QGIS project. This poses some obstacle for the knowledge transfer.
First, the end user must have the same tool that has been used for the analysis, and often the same version. If for the open source like QGIS, this can be easily achieved, for proprietary tools as ArcGIS is way more difficult. Second, GIS tools have a steep learning curve before familiarizing with them, and the final user of such kind of work is not interested, neither needs this kind of tool. Third, the final product is often a set of static maps. But there is any interaction with the dataset used to produce a map, unless the user is proficient with the tool that has been used to create the map.
Thanks to open-source tools, such as Flask.js, React.js and Dash, web development has become more accessible to non-purely web developer, as geoscientist and is now possible to present the same result obtained with a GIS software, within a web application. The advantages are manifold, among others:
- A web application is usually intuitive and easy-to-use. This means that the range of the target users is broader compared to range of the target users if the result is presented under a form of a written report or GIS software project;
- The final user can easily interact with the database in real time;
- The maintenance of a web app is minimal
Application Areas
- Environmental
- Civil and Geological Engineering
- Urban Planning
- Cities & Government
Methods and technologies that we use
- Data analytics and processing:
Python (NumPy, pandas, GeoPandas, Verde)
Multivariate analysis, Time Series analysis
Clustering, Dimensionality reduction
Prediction: Linear Regression, k-Nearest Neighbours, Random Forest, Support Vector Machines, Gradient Boosting, Deep Learning
QGIS, MapBox, Deck.gl
- Web Development:
Dash, Django
HTML, CSS, JavaScript
- Data Visualization and dashboarding
Python (Matplotlib, Plotly, Seaborn)
Dash, Tableau
Developed Web Applications
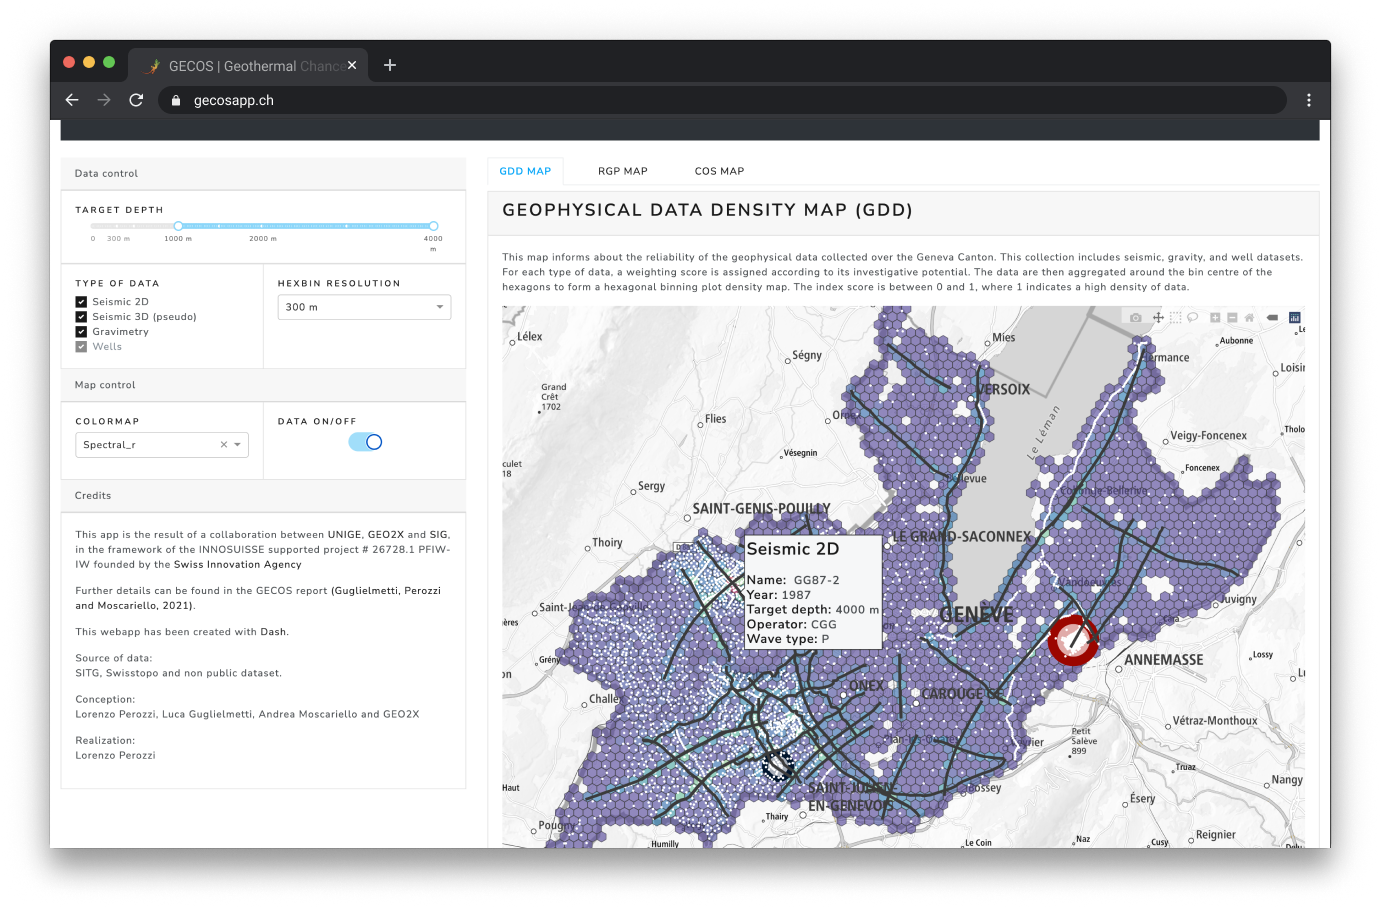
- Geothermal Chance of Success
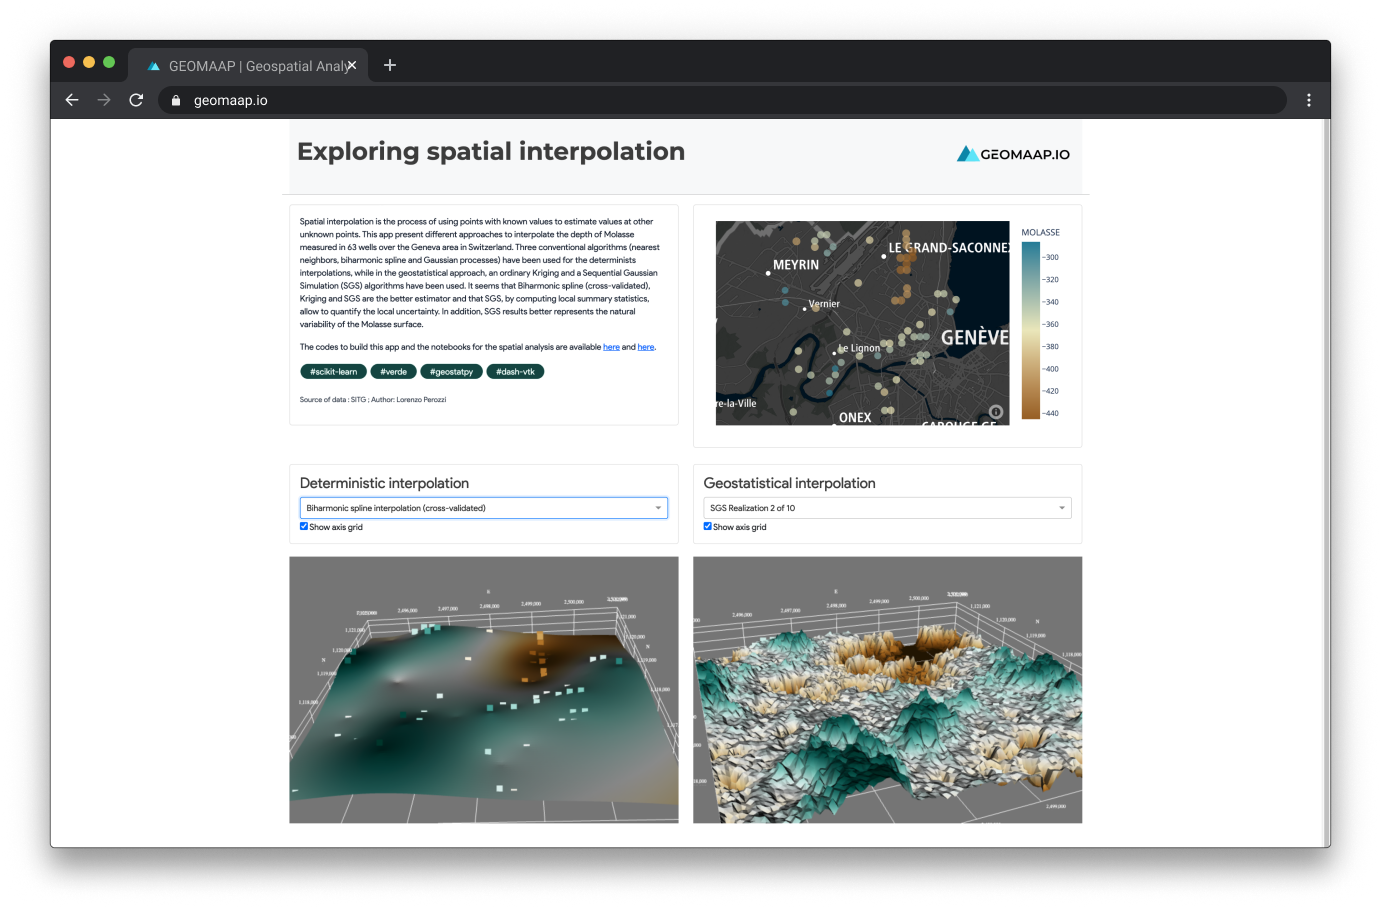
- Spatial Interpolation of the Molasse
More Services You Might Like
Geospatial analytics and uncertainty quantification
You need to explore and understand your data? GEOMAAP could help you to build surface and subsurface geospatial analysis and quantify the uncertainty.
Read MoreKnowledge
Sharing
You need to explore and understand your data? GEOMAAP could help you to build surface and subsurface geospatial analysis and quantify the uncertainty.
Read More