- Data Integration
- Stochastic realizations
- 2D/3D modeling
- Uncertainty analysis
- Data Visualization
- Open Source approach
Spatial Data Analytics and Uncertainty Quantification
- Home
- Spatial Data Analytics and Uncertainty Quantification

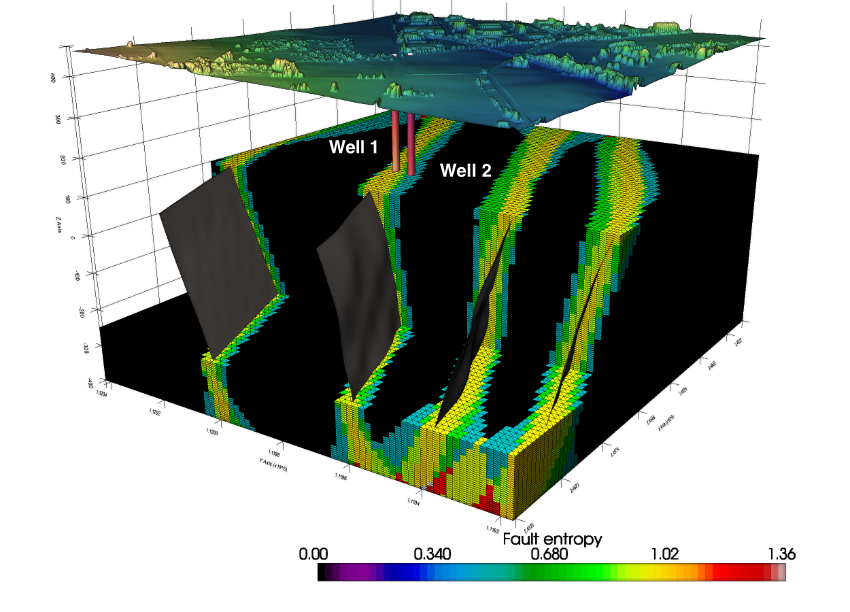
Uncertainty quantification
Dealing with uncertainty is a key aspect to consider for surface or subsurface characterization. It is neither possible nor optimal to build models of the reservoir properties at the resolution of the hard data. This data needs to be scaled up to a resolution that is a compromise between computational efficiency and geological heterogeneity. Once the resolution and extent have been defined, the model need to be populated with the rock properties (and structures) to quantify uncertainty. Conventional mapping techniques such as kriging, splines, inverse distance, and contouring algorithms are low-pass filters that remove high frequency property variations. The resulting model is a deterministic, smoothed distribution of the geological property, that reveal large-scale geological trends, but remove the extreme high and low values of the property of interest that often have a large effect on the reservoir performance.
Geostatistical simulation techniques, conversely, are devised with the goal of introducing the full variability, creating maps or realizations that are neither unique nor smooth. Although the small-scale variability of these realizations may mask large-scale trends, geostatistical simulation is more appropriate for predicting flow performance and modeling uncertainty.
Physical properties predicition
In this approach, we train a machine learning model between the porosity data and the seismic acoustic impedance, at the wells. This predictive model is then applied to the seismic cube of acoustic impedance to obtain a cube of porosity. The result is very interesting in terms of porosity distribution, however it has a limit. Indeed, although the chosen approach is stochastic, it does not take into account the spatial variation of the porosity, i.e. it cannot generate stochastic realizations which take into account the spatial variation of the porosity. To overcome this problem, we propose to use this result of the porosity prediction by Gradient Boosting as a secondary variable and generate several realizations of porosity (using well logs porosity as a primary variable) within a co-localized Gaussian sequential simulation (Co-SGS) framework. This stochastic approach allows us to take into account the spatial variability of porosity.
- Data Integration
- Machine Learning
- Stochastic realizations
- 2D/3D modeling
- Uncertainty analysis
- Data Visualization
- Open Source approach
Geostatistical interpolation
Common techniques used to interpolate geodata and obtain maps of the desired properties, such as the minimum curvature method, kriging, or even better gaussian process technique have a major limitation: they tend to oversample the mean value observed in the data while undersample the extreme low and high that are the most important in resource characterizations and environmental remediation. On the other hand, geostatistical methods have the advantage of preserving the variance observed in the data, instead of just the mean value as in deterministic interpolation. Geostatistical simulation, in particular, allows for the calculation of many equally probable realizations, which can be post-processed to quantify and assess uncertainty.
- Data Integration
- Interpolation
- Geostatistical Simulations
- Uncertainty quantification
- Data Visualization
- Open Source approach
Application Areas
- Environmental Characterization
- Geothermal Exploration
- CO2 Sequestration
- Gas Storage
Methods and technologies that we use
- Data analytics and processing:
Python (NumPy, pandas, GeoPandas, Verde)
QGIS
OpendTect
- Geostatistics:
Python (NumPy, pandas)
Kriging, Cokriging
Stochastic simulations
- Machine Learning:
Python (NumPy, pandas, scikit-learn)
Multivariate analysis, Time Series analysis
Clustering, Dimensionality reduction
Prediction: Linear Regression, k-Nearest Neighbours, Random Forest, Support Vector Machines, Gradient Boosting, Deep Learning